Fractional Momentum Strategy II
Introduction
The FD-II framework (Fractional Differencing with Turnover Management) advances momentum and reversal trading by embedding sequential decision-making into a scalable convex optimization. Instead of smoothing predictive signals, FD-II preserves their high-frequency informativeness and constraints only the portfolio's reaction through two innovations:
- ℓ1 turnover penalization, which directly controls trading intensity, and
- Path-Dependent Constraints (PDCs), which enforce realistic trading rules such as inertia, bounded entry, and side-switching delays.
This design substantially reduces transaction costs while maintaining signal responsiveness. In doing so, FD-II transforms high-turnover anomaly strategies—long thought impractical for daily rebalancing—into robust performers. Empirical results demonstrate 95-99% turnover reduction, 76-99% drawdowns cut to 22-49%, and net Sharpe gains of 38-149%, enabling daily trading of factor portfolios at net performance levels previously associated only with monthly horizons.
Performance Teaser
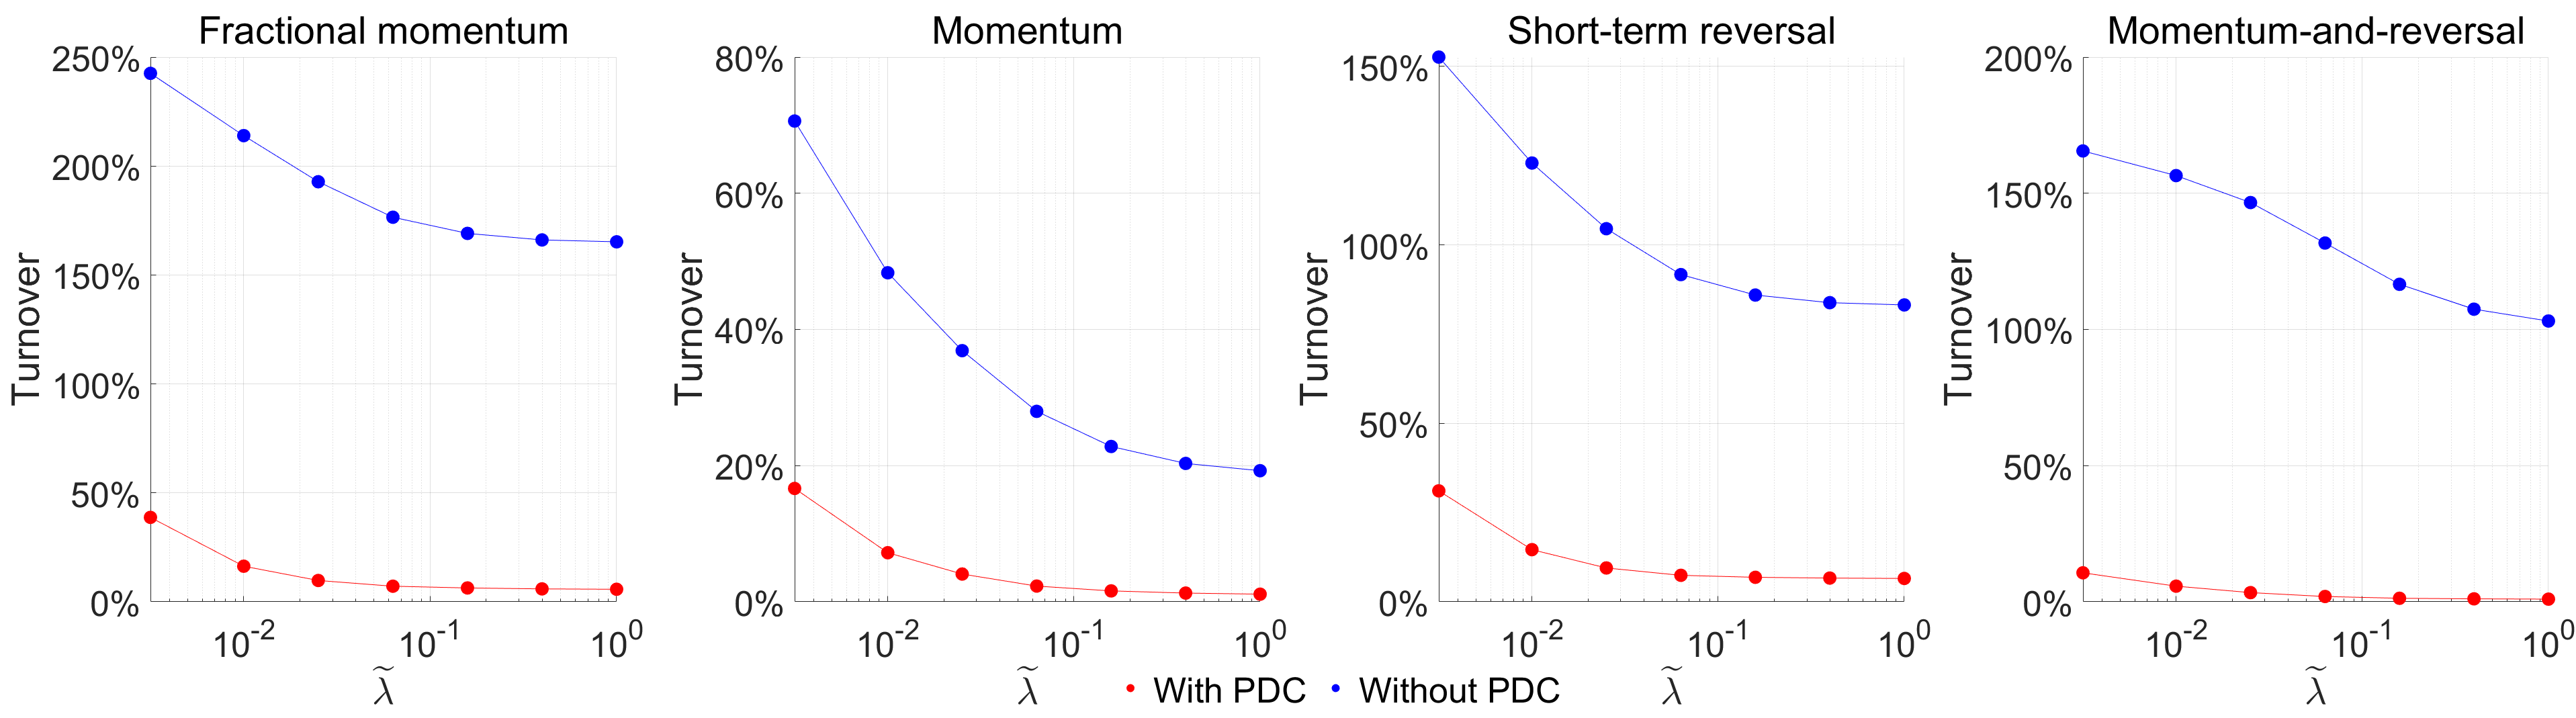
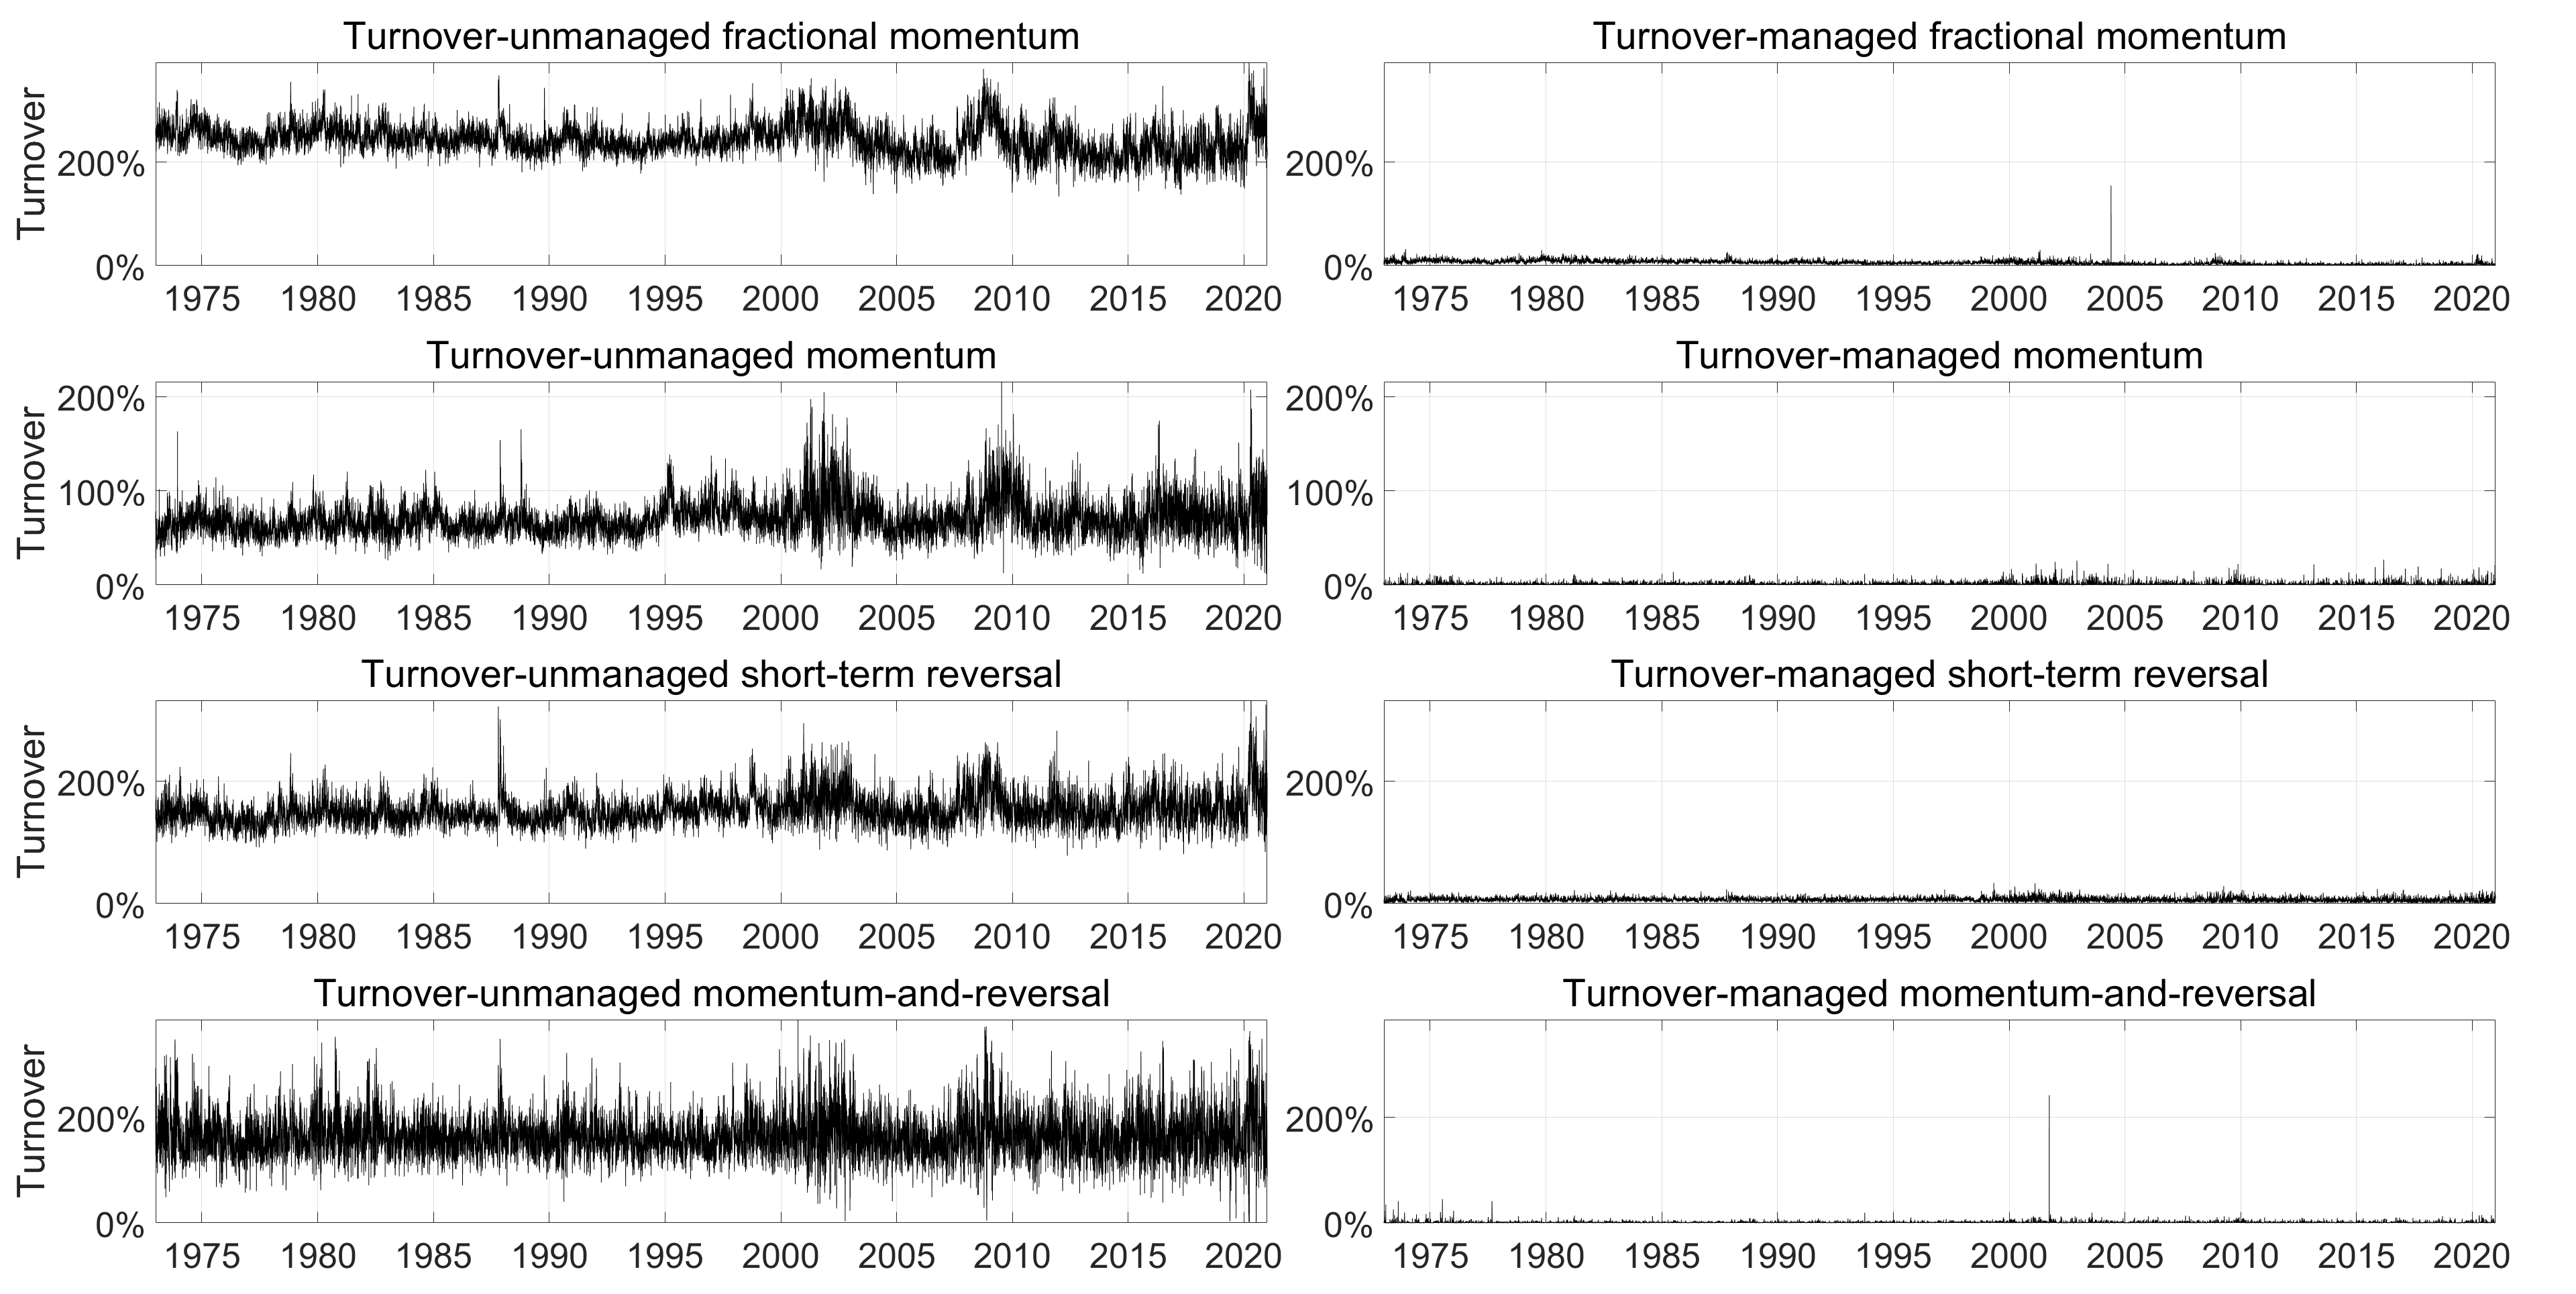
The plots below highlight the dramatic effect of turnover control:
Turnover: Unmanaged strategies exhibit daily turnovers of 70-240%, while FD-II reduces this to 1-6%.
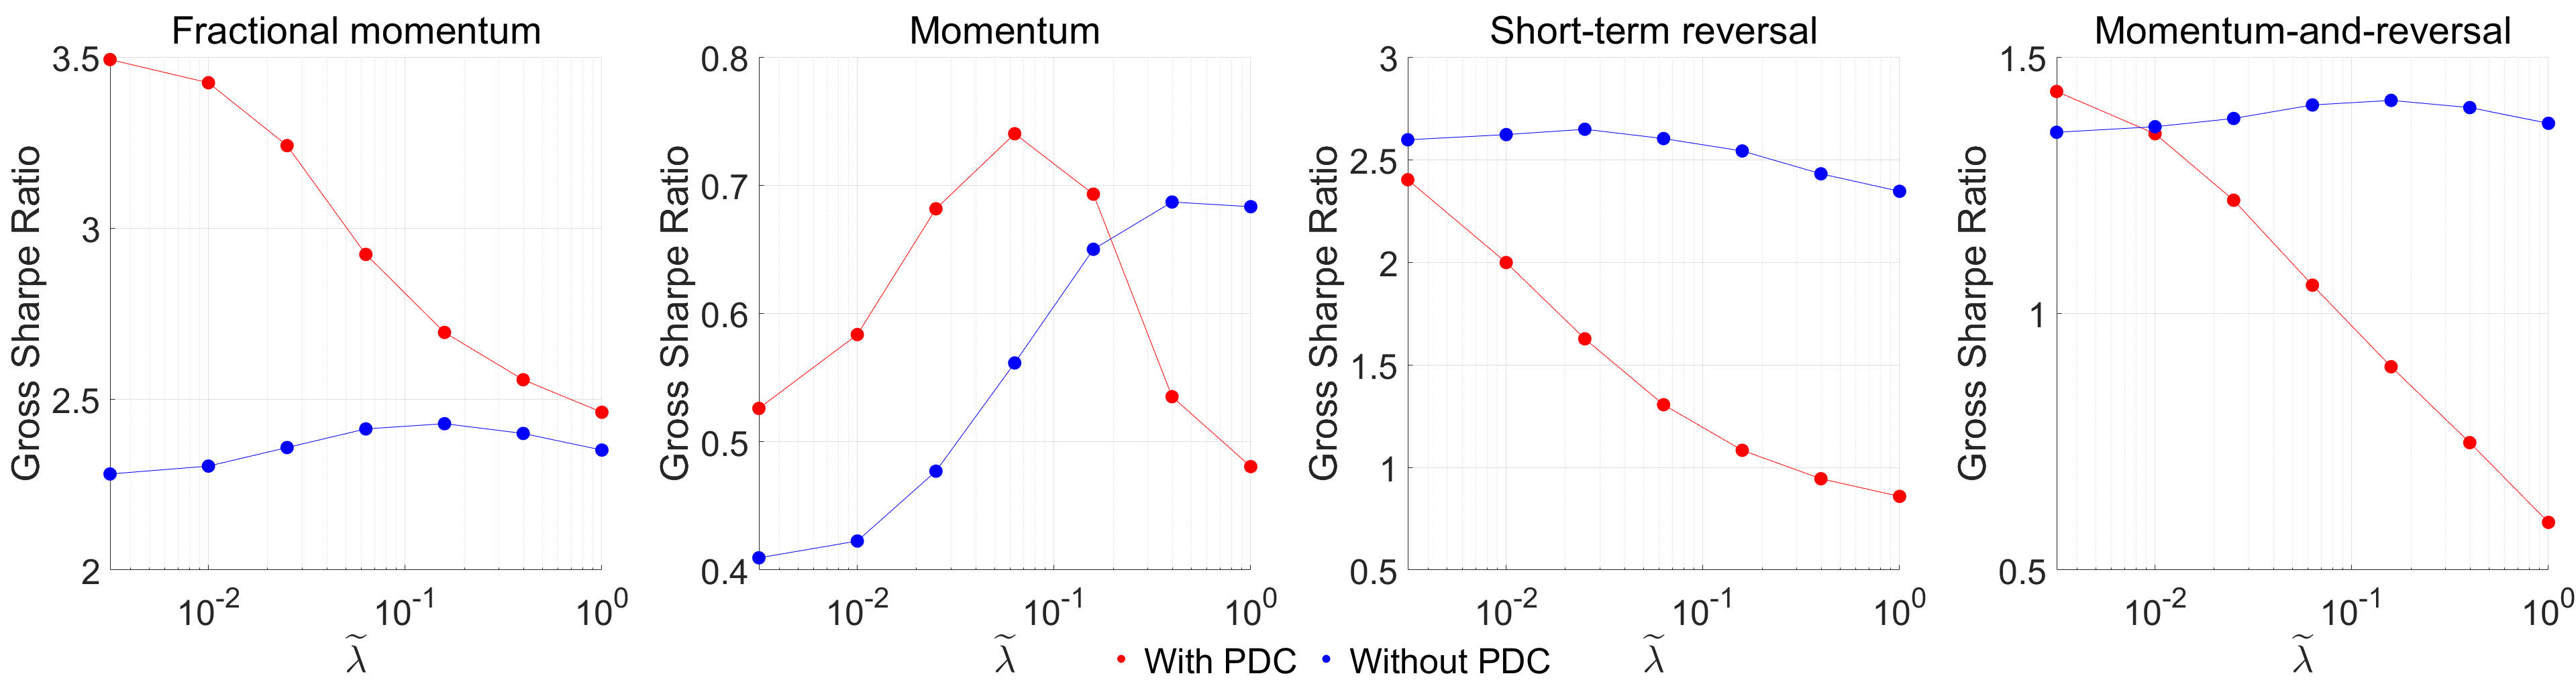
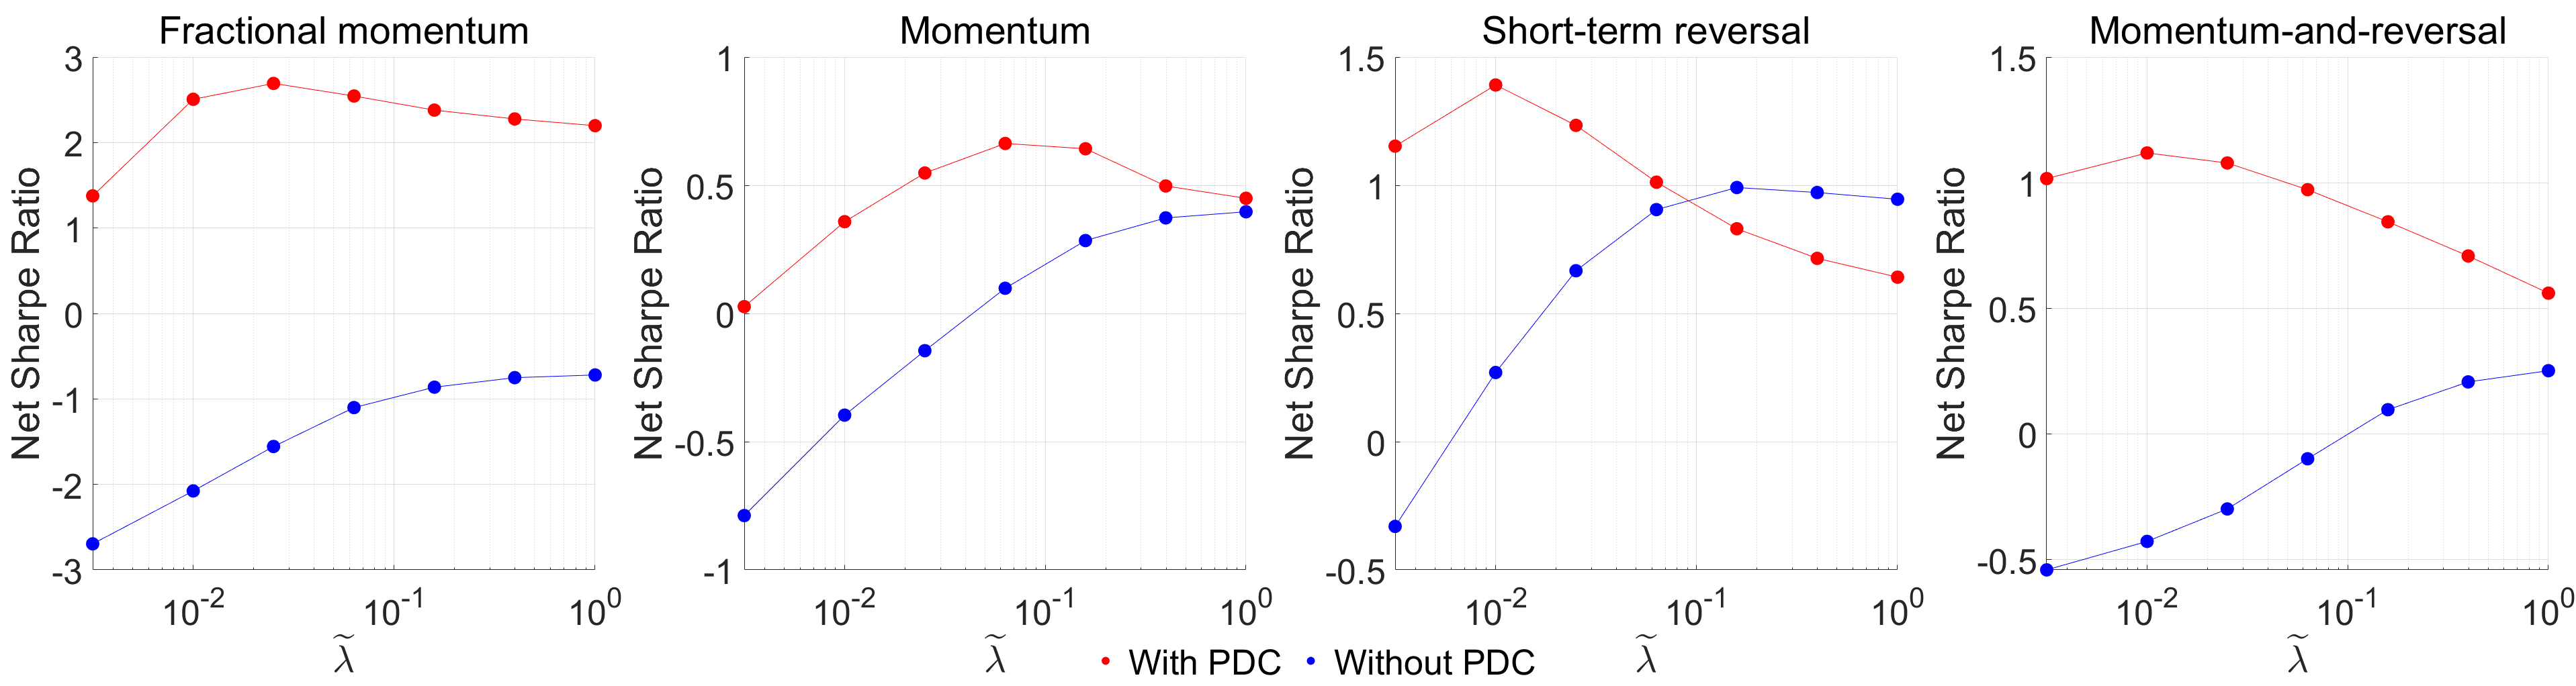
Gross vs. Net Sharpe: While turnover management can reduce raw signal exploitation, the net effect after 10bps costs is strongly positive—e.g., fractional momentum reaches a net Sharpe ratio of 2.69.
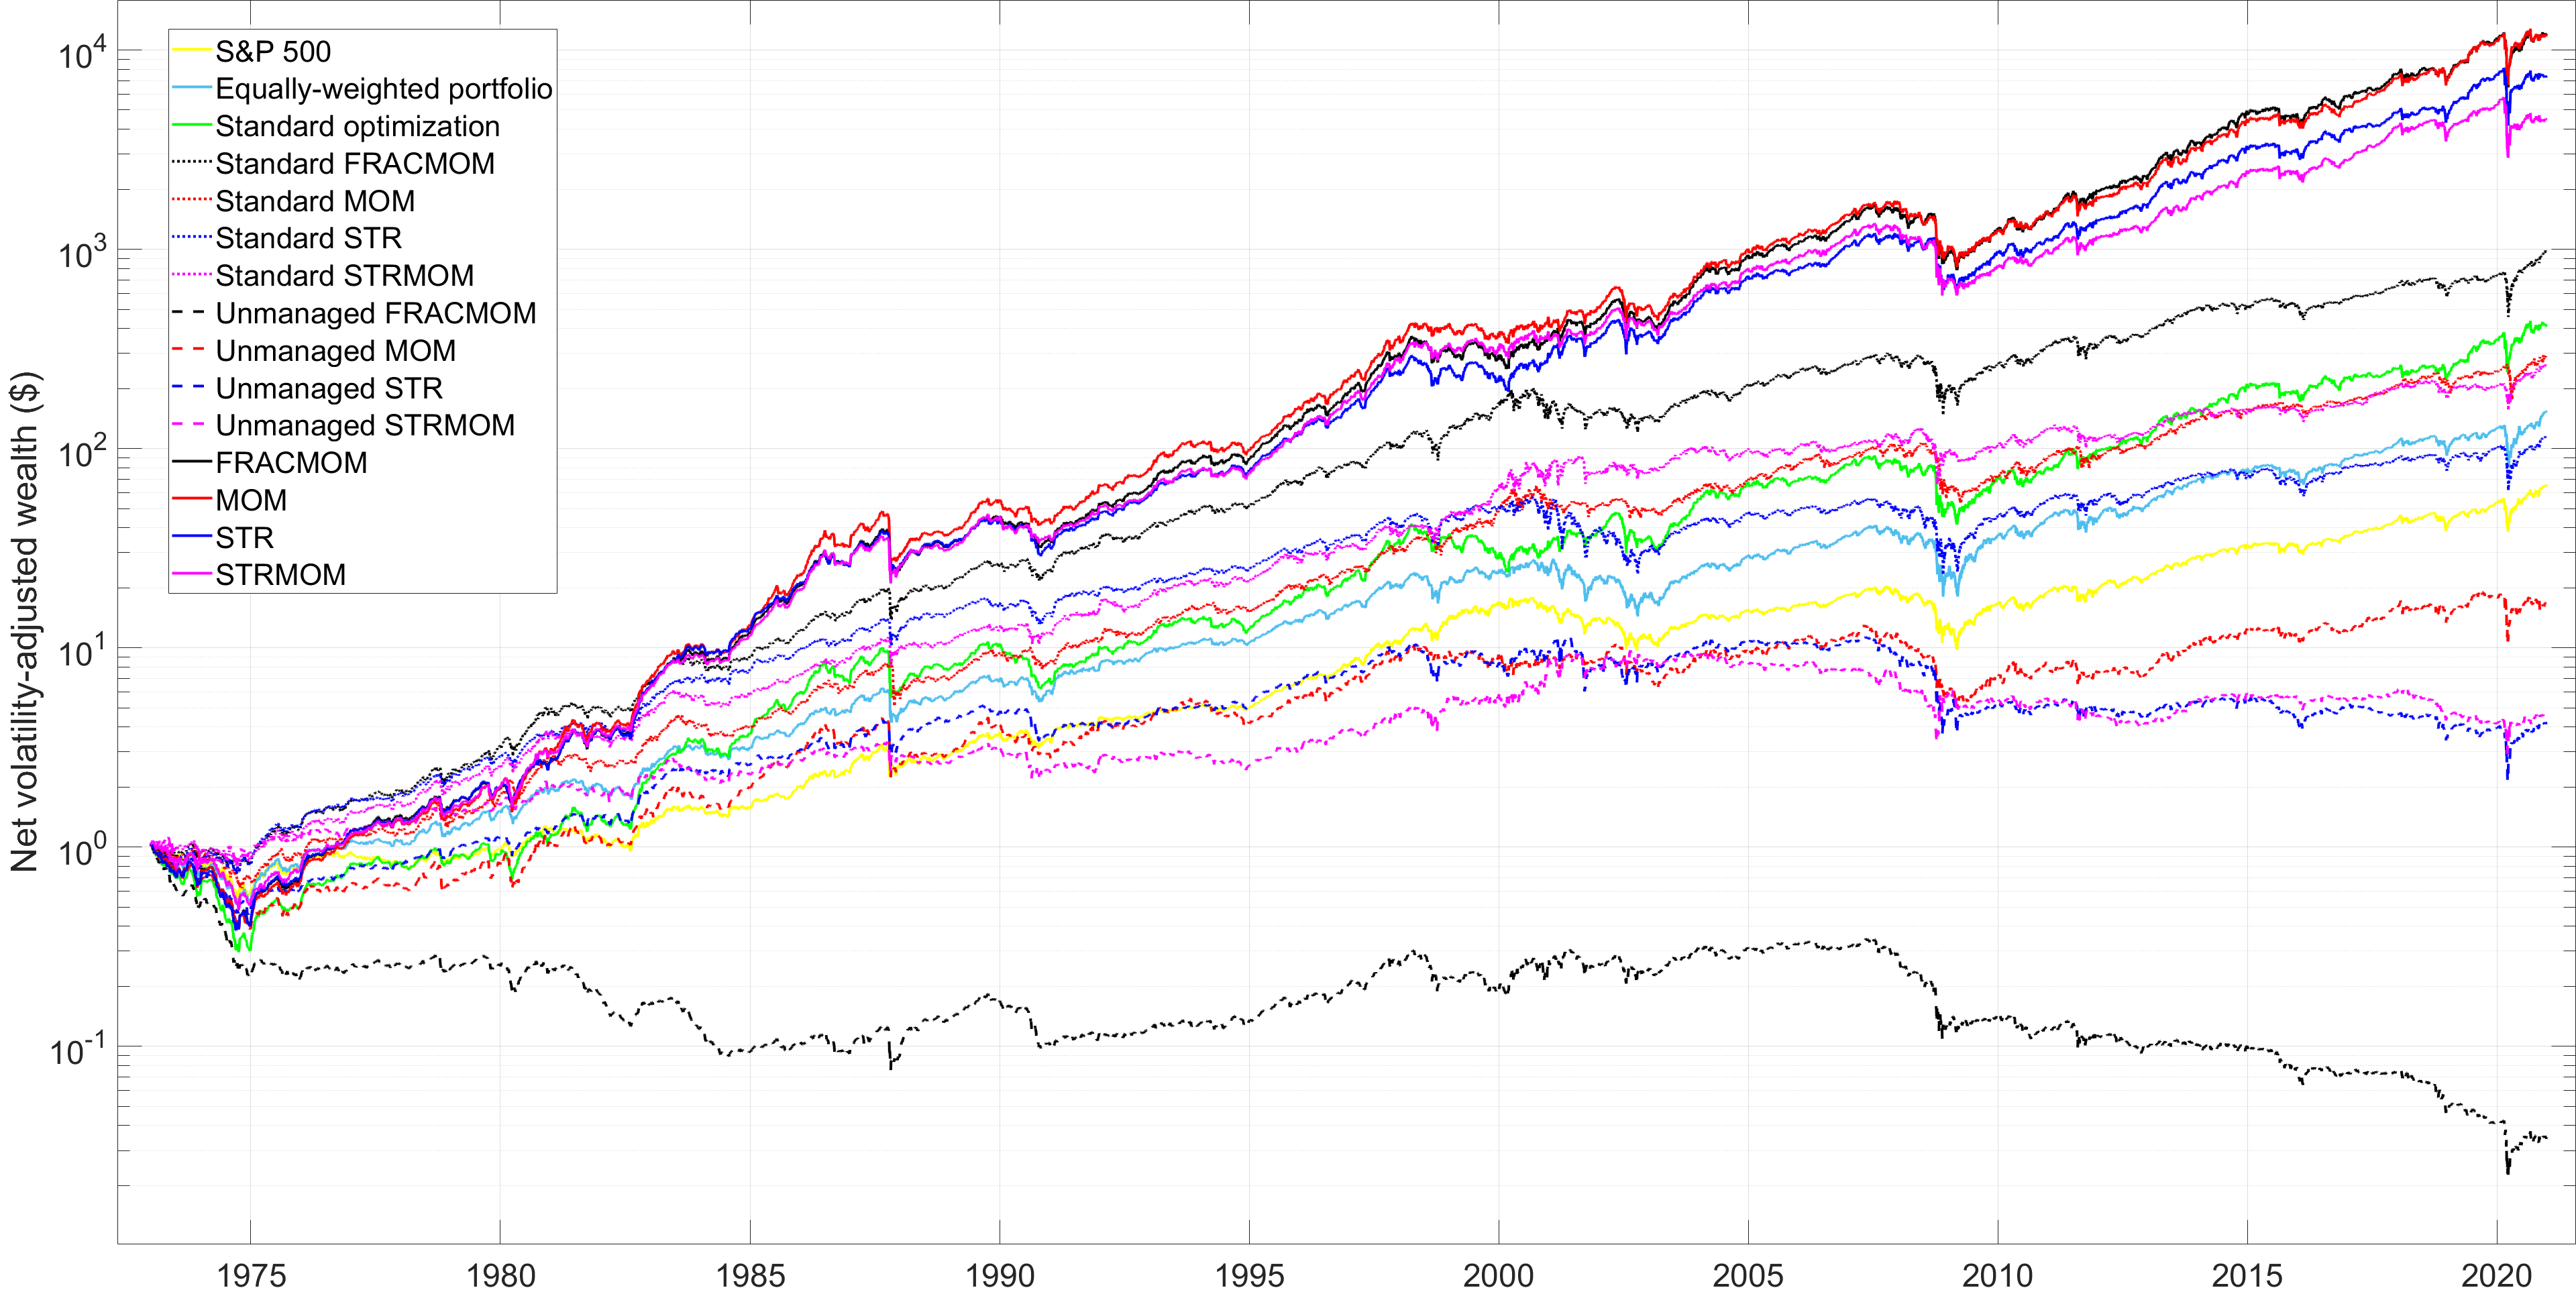
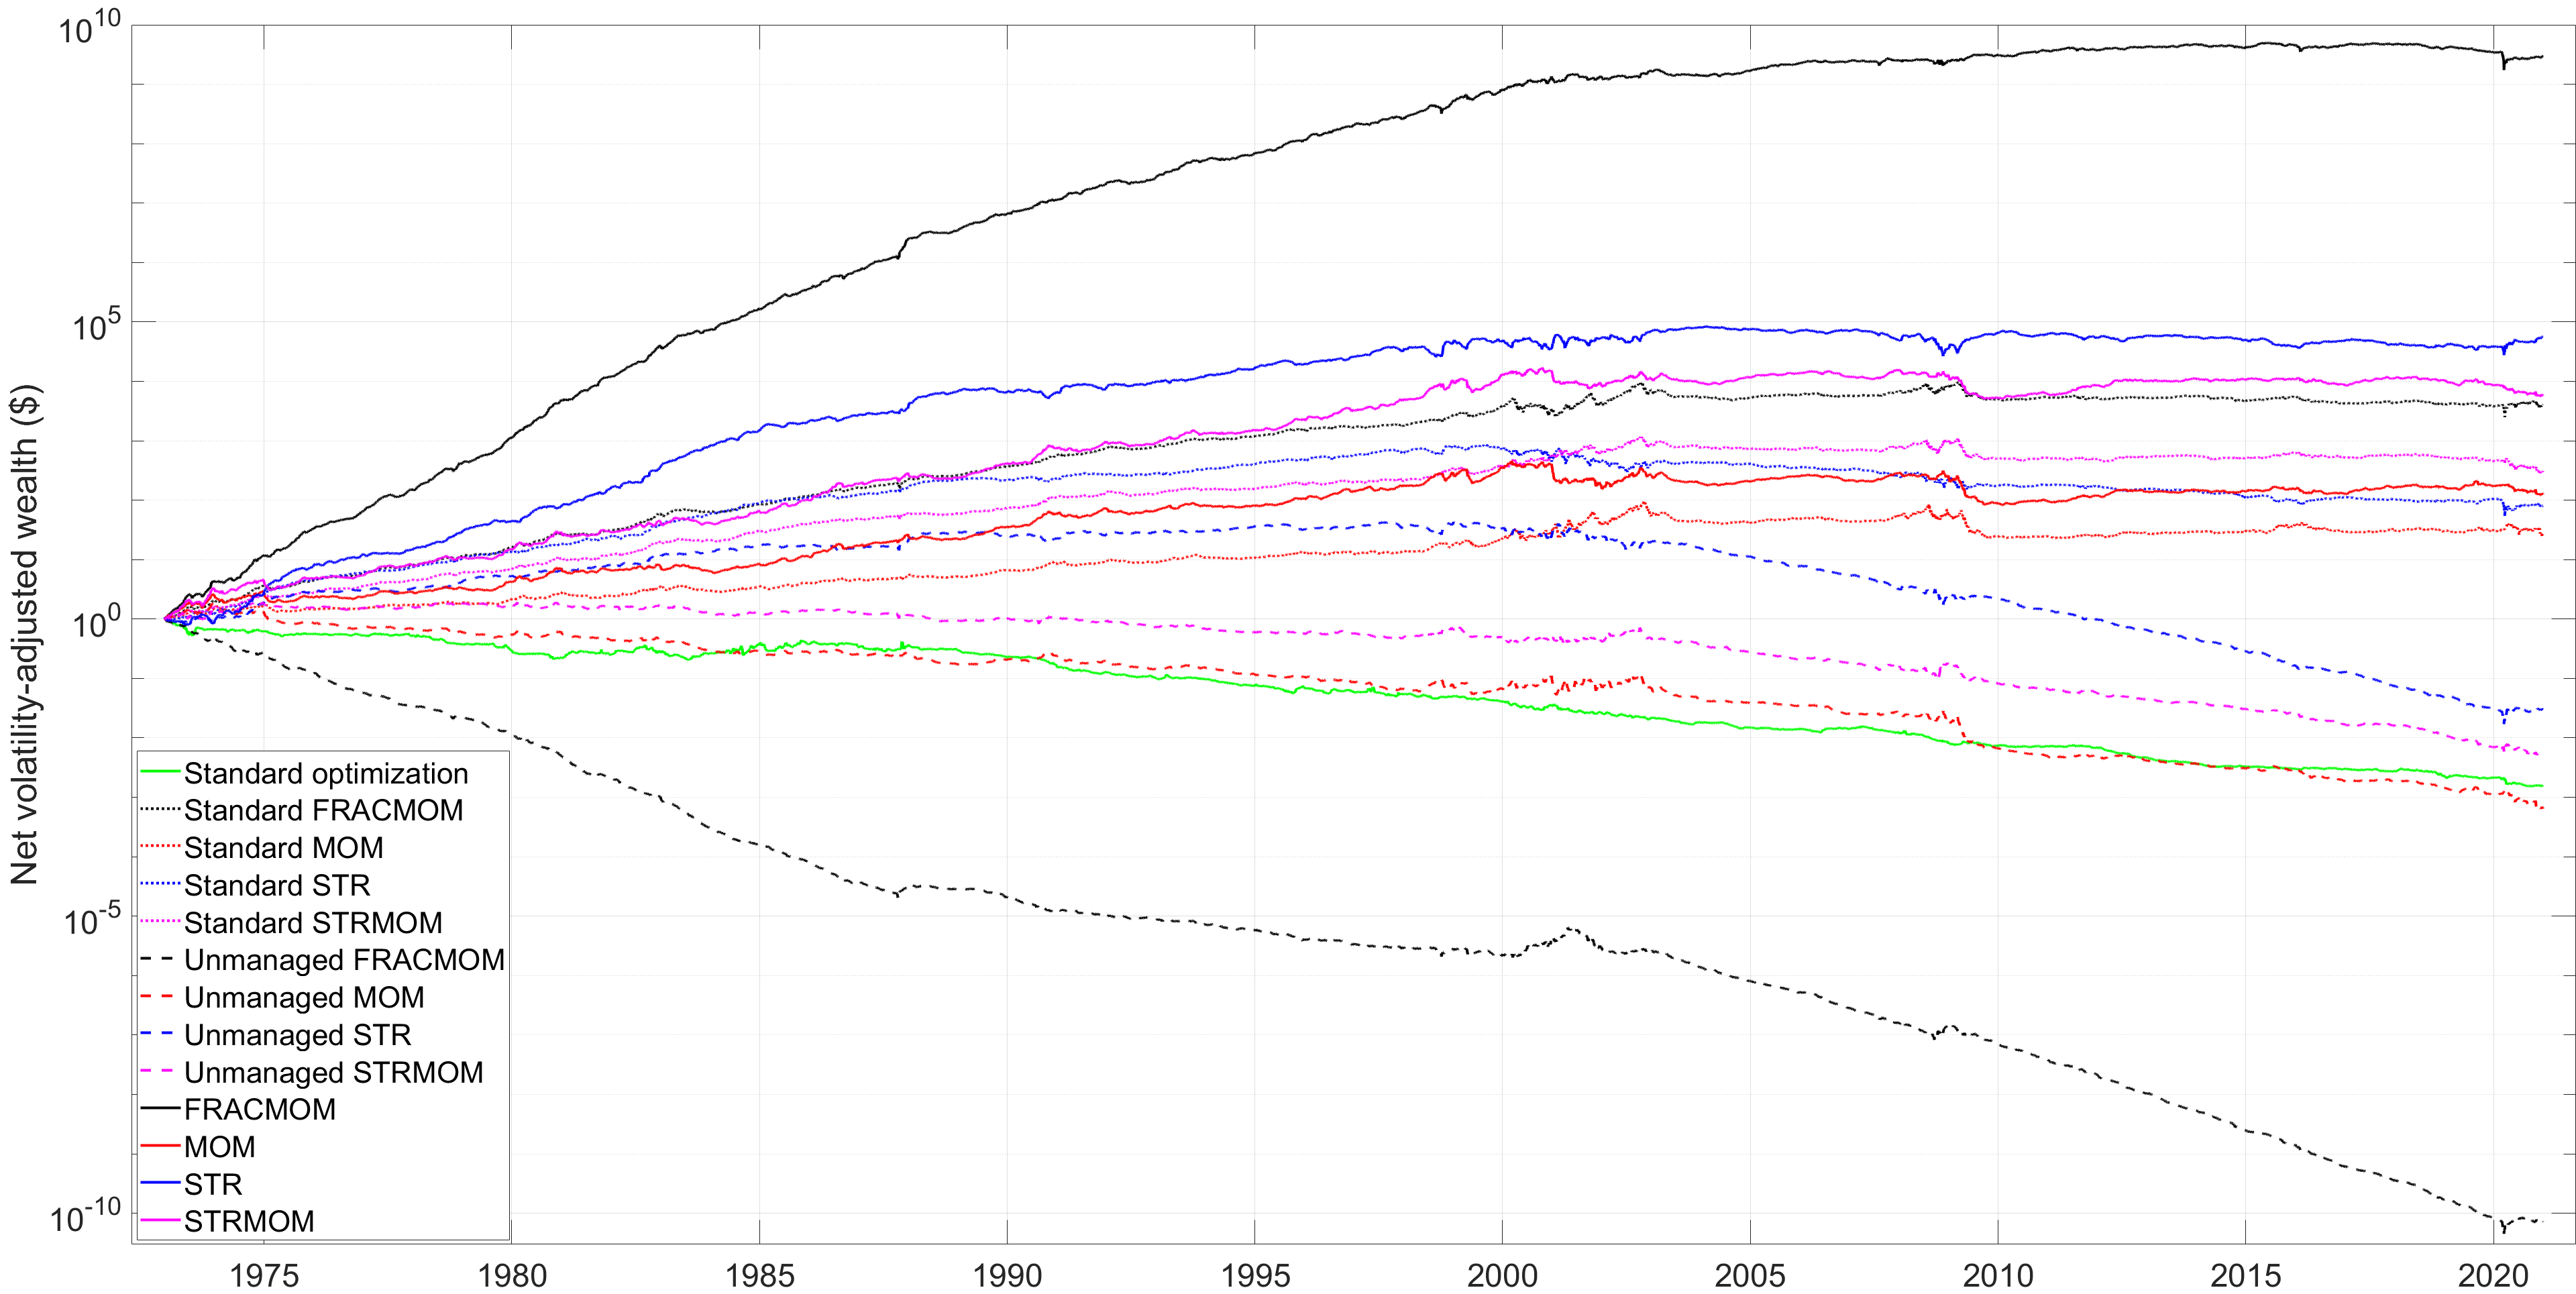
Wealth trajectories: With FD-II, both long-short and long-only implementations deliver stable volatility-adjusted wealth growth, surpassing traditional benchmarks such as Markowitz optimization, equal-weighted portfolios, and unmanaged anomaly sorts.
Key Performance Results
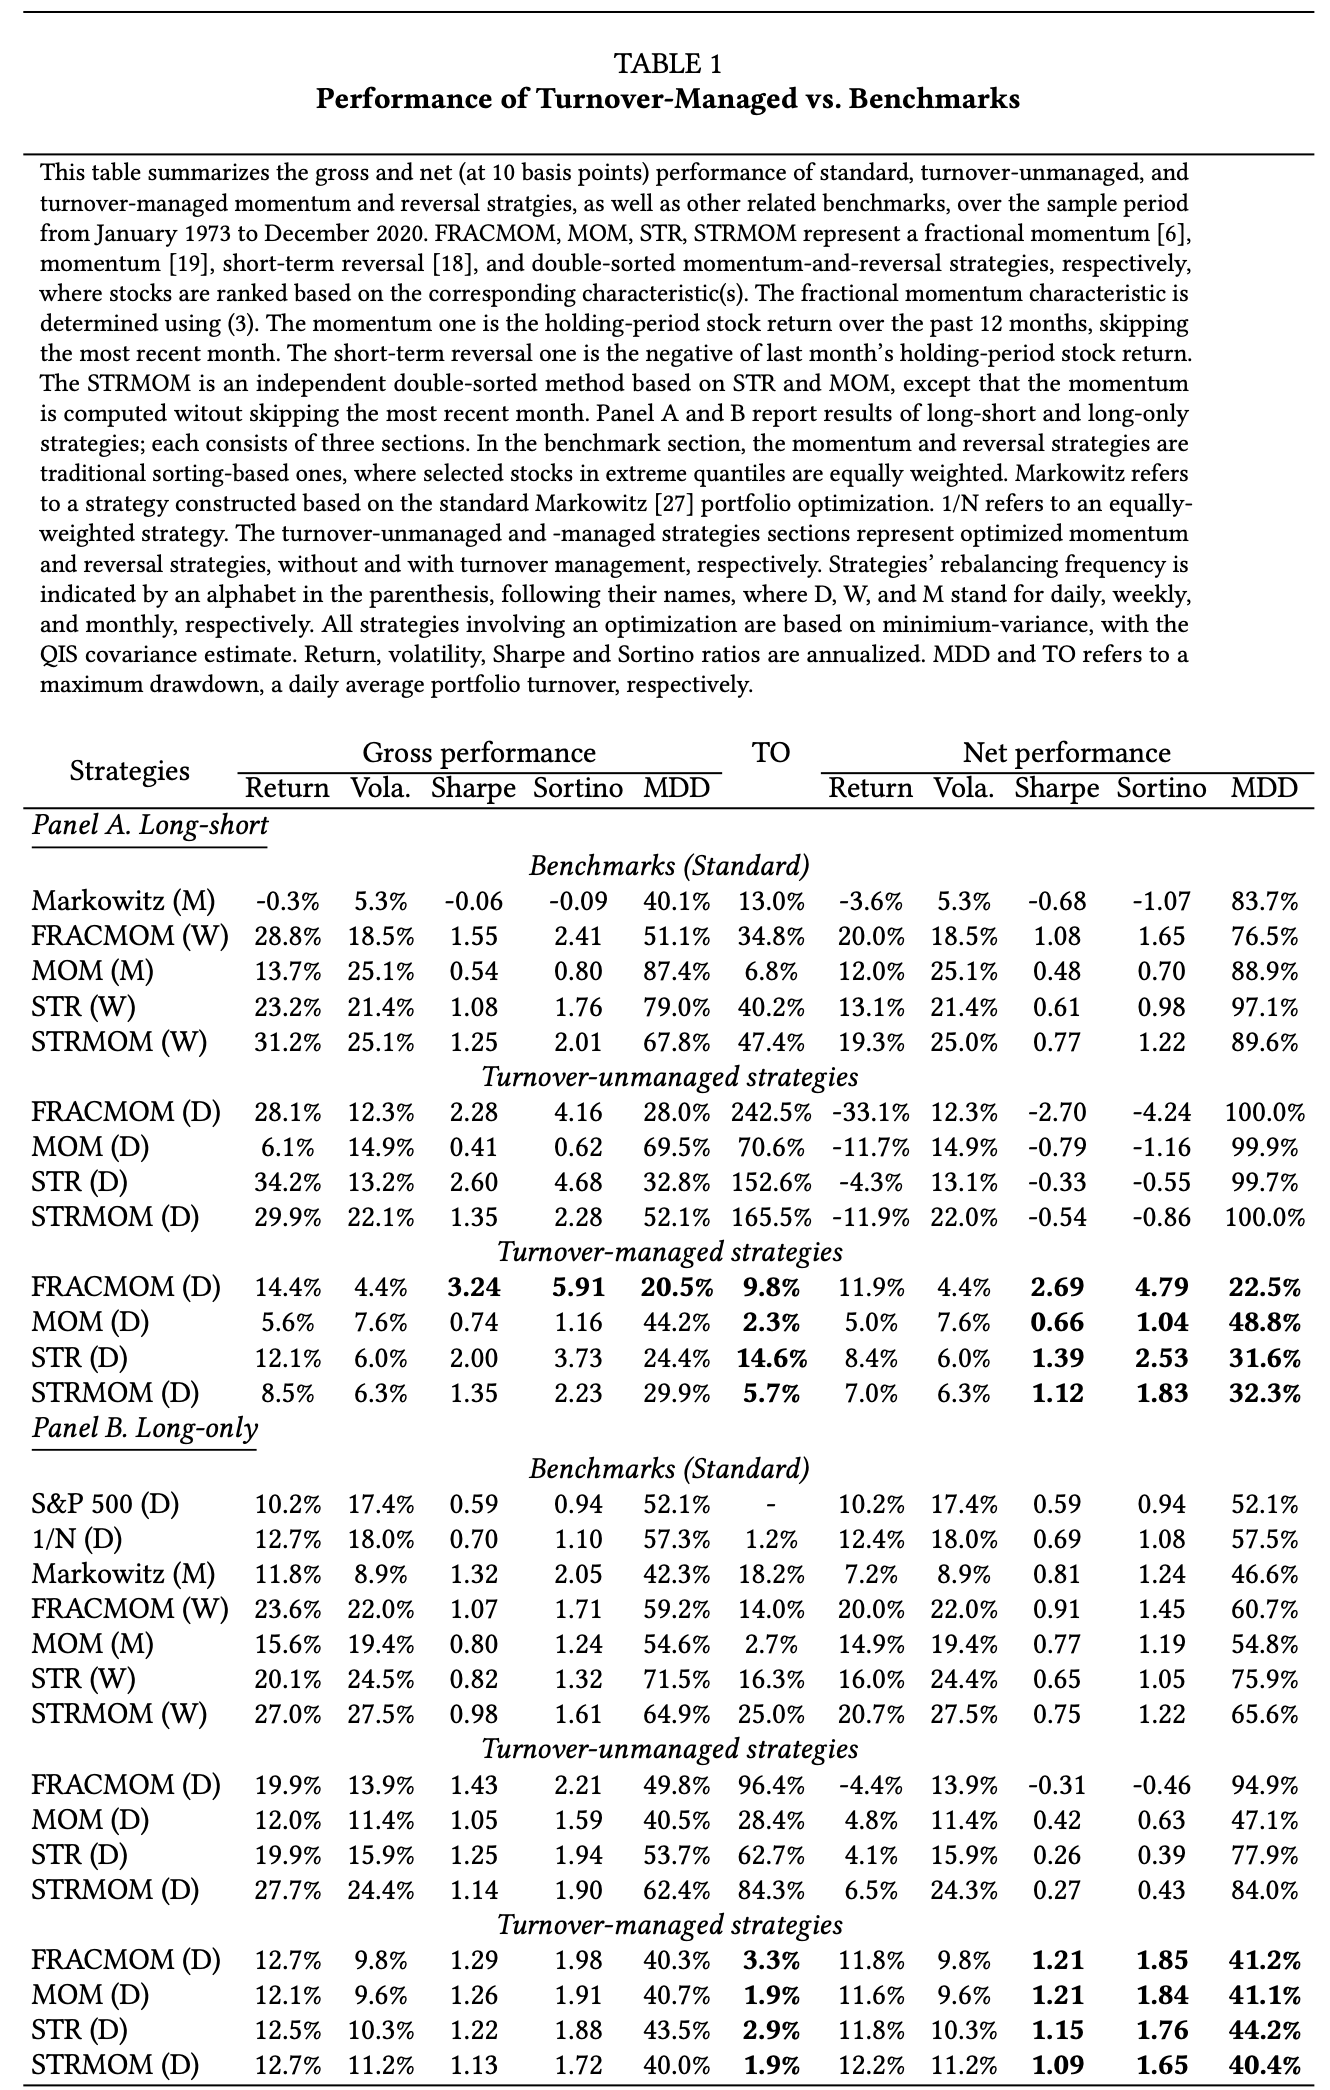
The table illustrates the net effects of turnover management. A few highlights:
-
Long-short portfolios (Panel A):
- FRACMOM (D) improves from -2.70 net Sharpe (unmanaged) to +2.69 with FD-II.
- STR (D) rises from -0.33 to +1.39 net Sharpe.
- Across anomalies, drawdowns shrink from near-100% to ~20-40%.
-
Long-only portfolios (Panel B):
- MOM, STR, and STRMOM all stabilize with Sharpe ratios in the 1.1-1.2 range, competitive with institutional long-only mandates.
- Maximum drawdowns fall by 15-30 percentage points relative to unmanaged baselines.
Methodology Notes
- Investment universe: Daily CRSP data (NYSE/AMEX/NASDAQ), 1973-2020, filtered to 500-1000 mid/large-cap stocks. Microcaps excluded.
- Transaction cost model: Linear, 10bps per turnover unit.
- Strategies tested: 12-month momentum (MOM), 1-month short-term reversal (STR), double-sorted MOM-STR (STRMOM), and fractional momentum (FRACMOM).
- Optimization: Minimum variance with QIS covariance shrinkage.
- Turnover controls: ℓ1 penalties + PDCs (no smoothing of predictive signals).
Cite this work
This work relies on our paper Smoothing Out Momentum and Reversal. This paper can be cited as:
Chitsiripanich, Soros and Paolella, Marc S. and Polak, Pawel and Walker, Patrick S., Smoothing Out Momentum and Reversal (Semptember 13, 2024). Swiss Finance Institute Research Paper No. 24-47, Available at SSRN: https://papers.ssrn.com/sol3/papers.cfm?abstract_id=4955388
BibTeX citation
            @article{smoothing-out-momentum-and-reversal,
                author = {Soros Chitsiripanich and Marc S. Paolella and Pawel Polak and Patrick S. Walker},
                title = {Smoothing Out Momentum and Reversal},
                journal = {Swiss Finance Institute Research Paper No. 24-47},
                year = {2024},
                note = {https://papers.ssrn.com/sol3/papers.cfm?abstract_id=4955388}
            }