Fractional Momentum Strategy I
Introduction
The Fractional Momentum Strategy leverages empirical finance research and advanced computational methods to optimize investment portfolios. It applies a fractional-difference filter to historical price data, preserving long-term memory while mitigating large drawdowns common in traditional momentum and reversal strategies. By incorporating a comprehensive range of historical data, the strategy enhances risk-adjusted returns and remains resilient against transaction costs and market frictions.
Empirical evaluations demonstrate its consistent performance across various asset classes and international markets, with portfolios rebalanced on a weekly basis. The evaluation process accounts for dividends and stock splits.
Performance Teaser
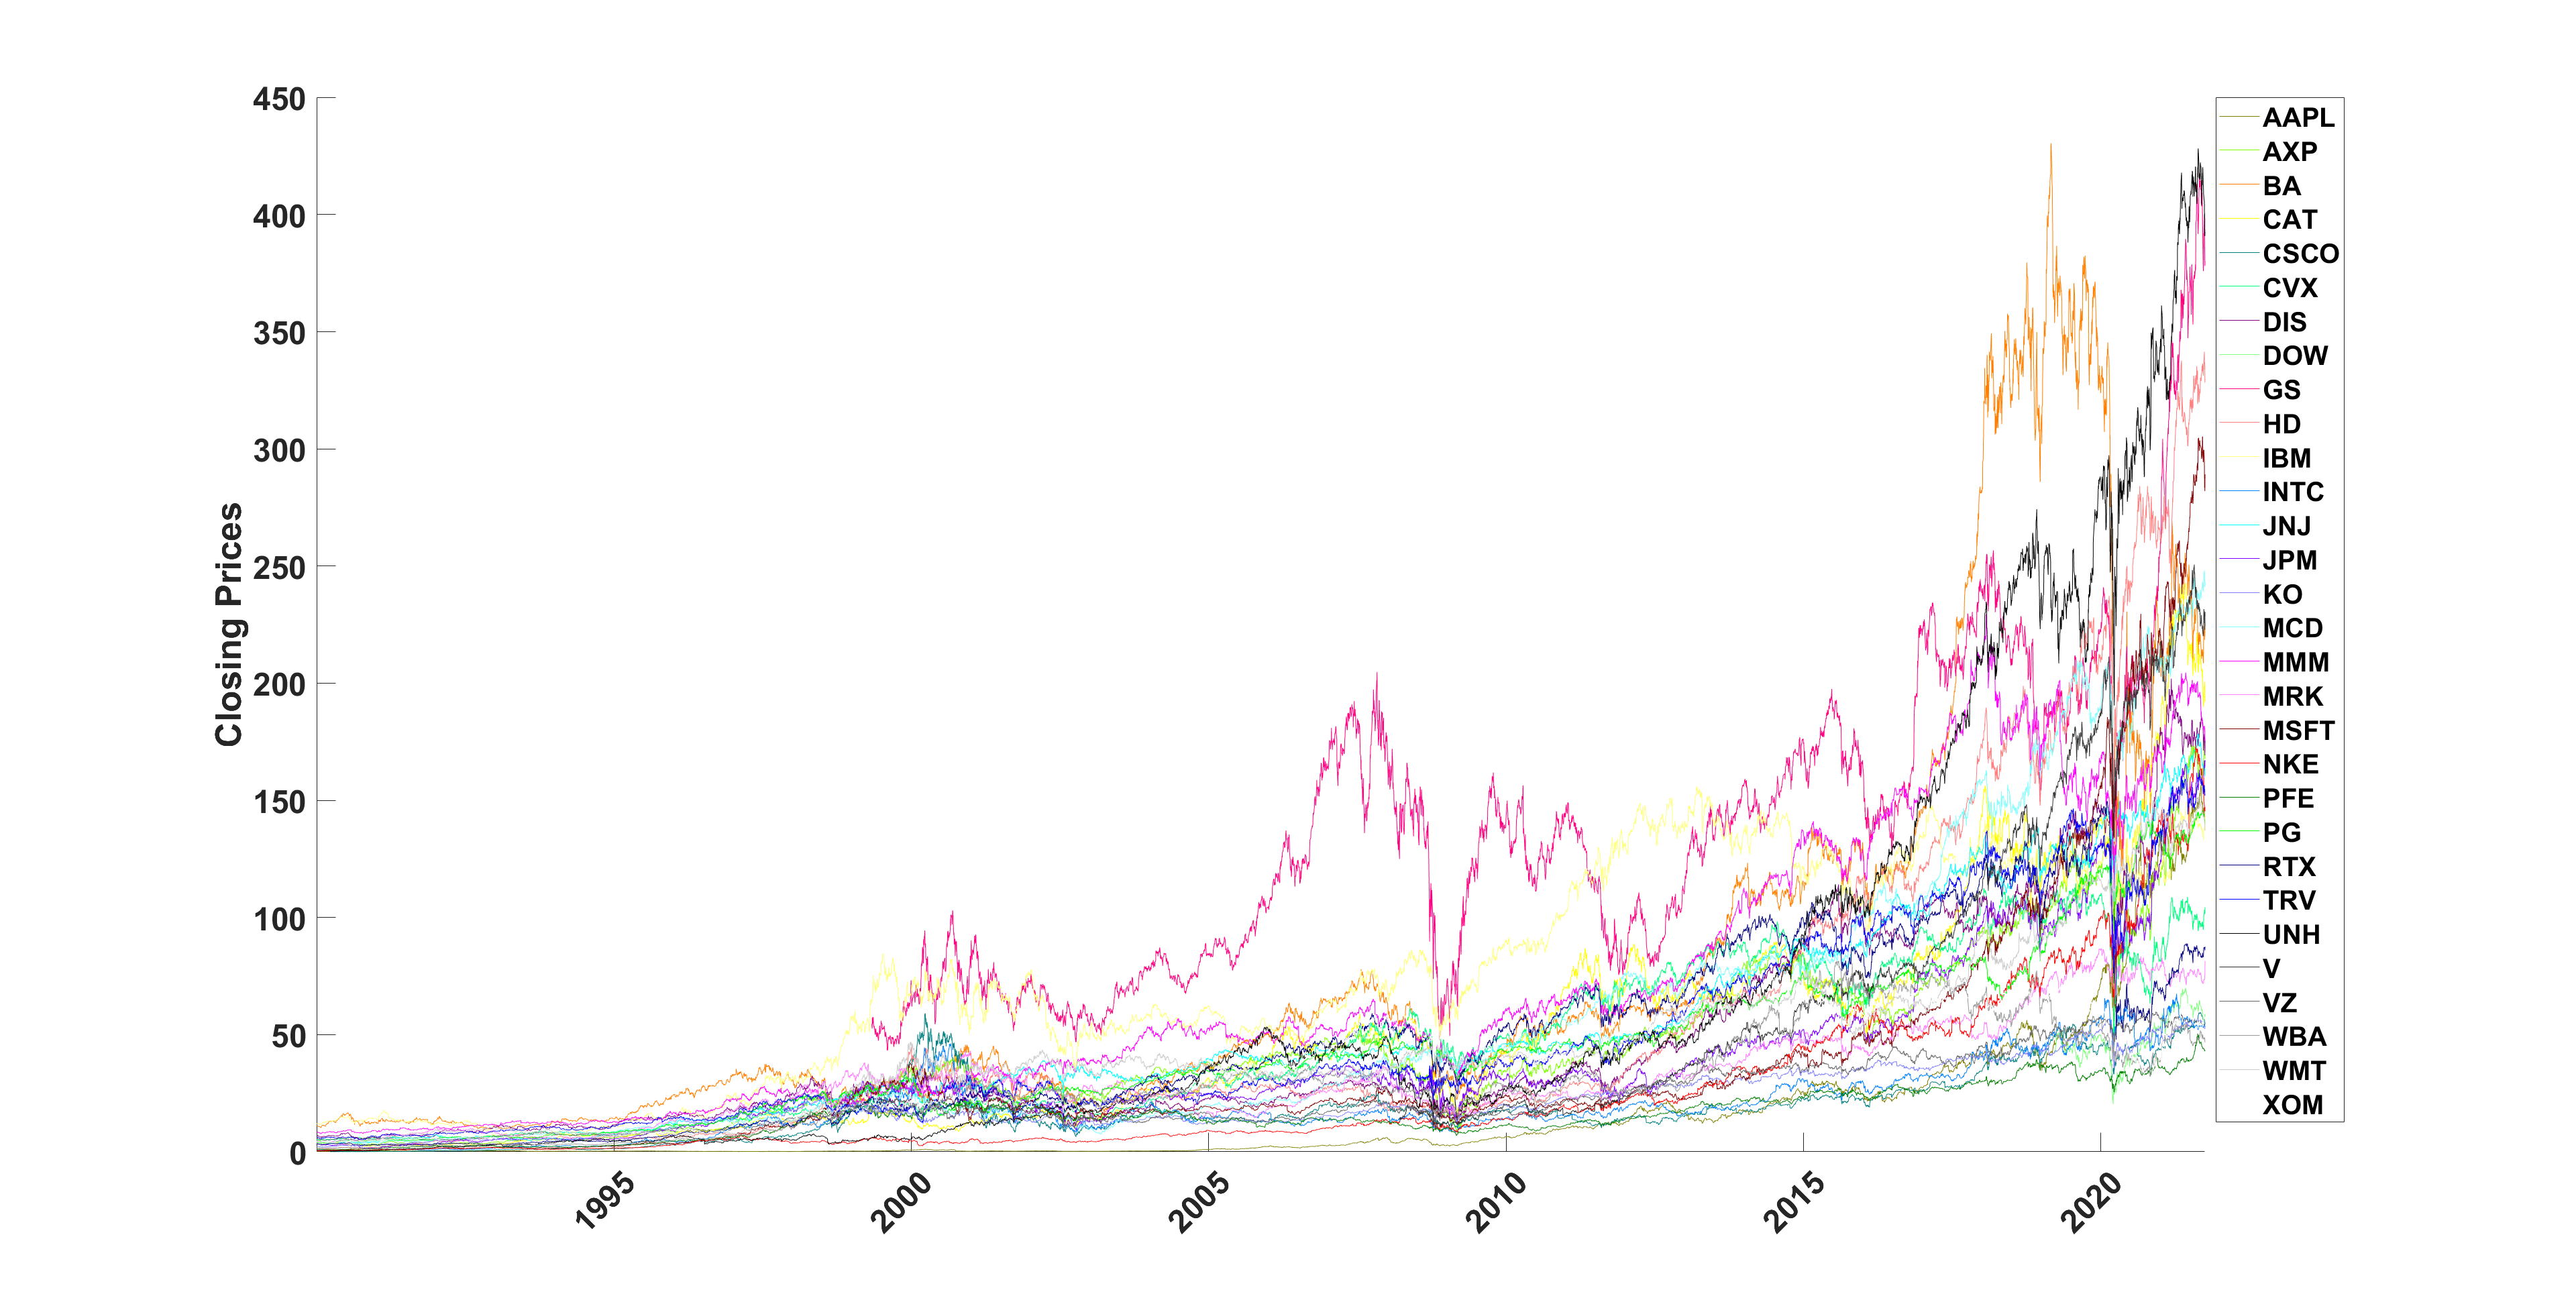
The following plot illustrates the evolution of daily prices of the 30 DJIA US stocks. These 30 stocks represent a subset of the 1,000 to 2,000 stocks analyzed. Viewing them this way does not reveal how to construct an efficient portfolio.
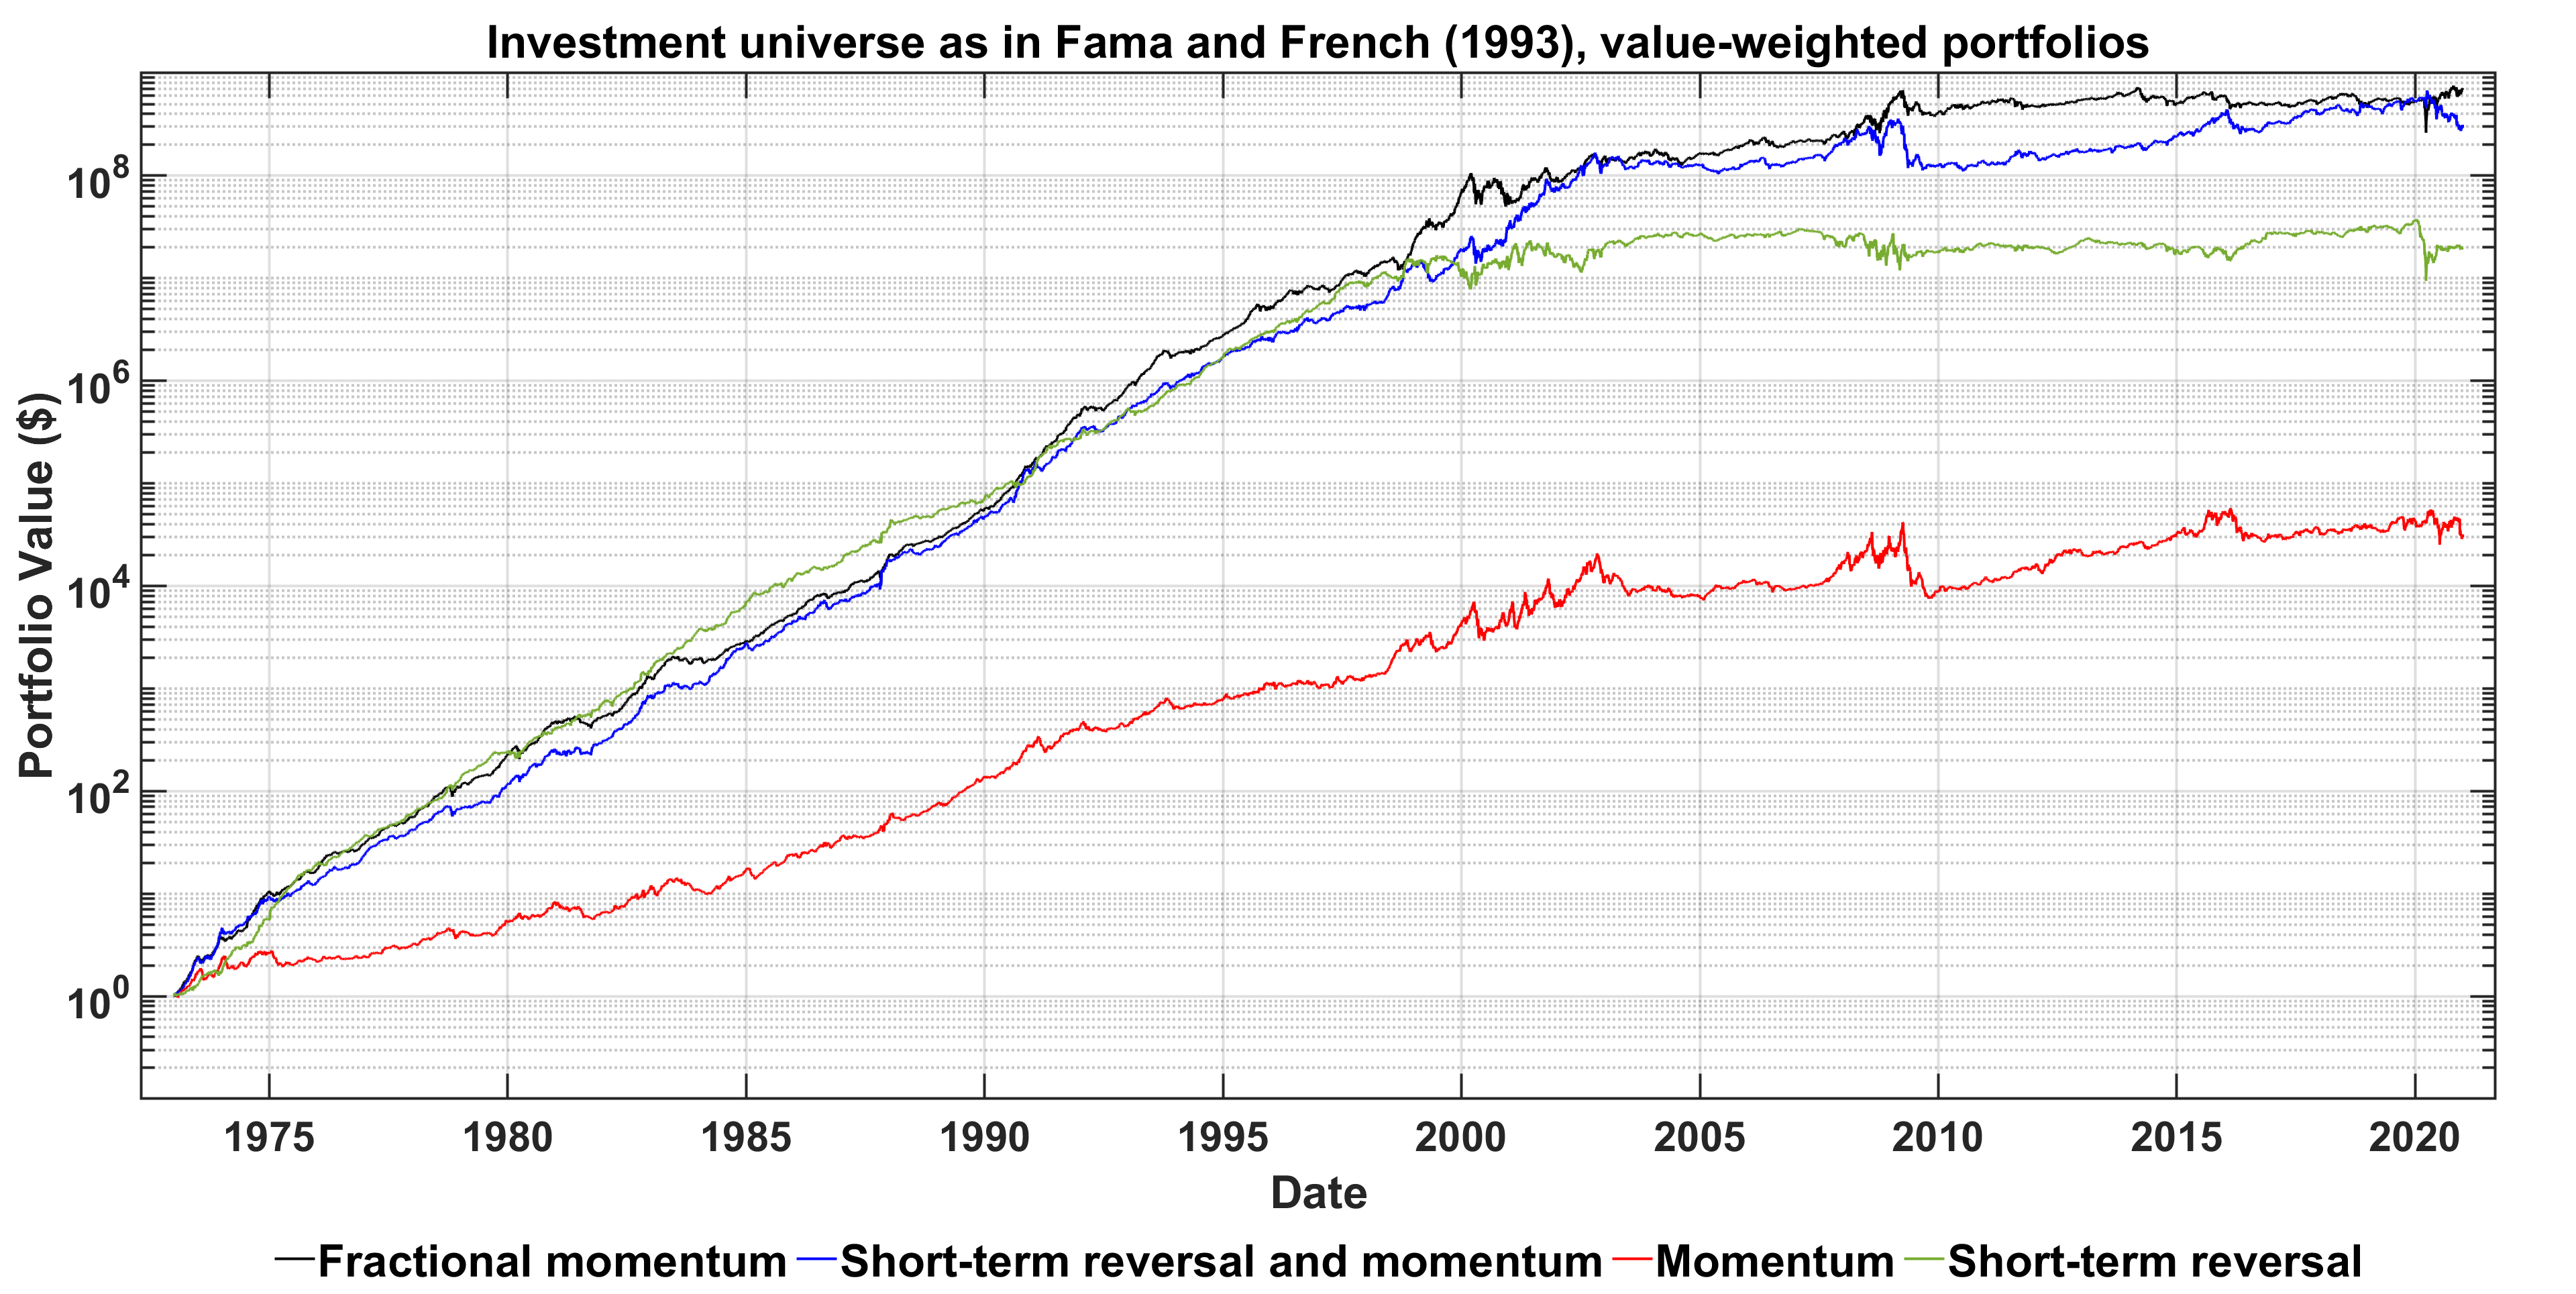
The next plot below shows performance over time, out-of-sample, when using our Fractional momentum methodology. It is based on a selection methodology from the 1000 to 2000 stocks in our universe. When comparing our method to other strategies such as Markowitz (with GARCH), but notably, as shown in the graphic below, the more advanced strategies of momentum, short-term reversal and momentum and short-term reversal, ours is superior with respect to all measures of interest, such as total wealth accumulation and all common risk measures.
Key Performance Results
| Value-Weighted Net Performance | Return | Sharpe | Sortino | Max. DD. |
|---|---|---|---|---|
| Fractional Momentum | 34.5% | 1.35 | 2.14 | 63.9% |
| Short-Term Rev. and Mom. | 31.6% | 1.16 | 1.90 | 69.4% |
| Momentum | 23.9% | 0.81 | 1.22 | 82.0% |
| Short-Term Reversal | 26.5% | 0.98 | 1.59 | 74.8% |
We now provide a table summarizing the key performance results that pertain to the above graphic.
The following bullet points indicate relevant information on our methodology and choice of data used to generate the numbers in the table above:
- The table presents the economic performance, net of a 10-basis point transaction cost, of our 'Fractional Momentum' strategy versus benchmark strategies.
- It details our dollar-neutral strategy that invests in the top 10% and shorts the bottom 10% of stocks ranked by fractional momentum.
- The investment universe includes a dynamic range of 1,000 to 2,000 U.S. stocks, following Fama and French (1993), avoiding selection bias by accounting for both listings and delistings.
- To minimize the impact of microcap stocks, those below the 20th percentile of NYSE market equity are excluded, with selection weighted by market capitalization.
- Our Momentum (MOM) strategy is based on past twelve-month performance, excluding the latest month, while the Short-Term Reversal (STR) strategy focuses on the past month's negative performers.
- The STRMOM strategy employs a double-sort method, sorting stocks by both MOM and STR criteria for a strategic long/short portfolio based on short-term underperformance and medium-term performance.
- The fractional momentum approach combines momentum and reversal signals through a fractional-difference filter, significantly improving risk-adjusted returns and reducing drawdowns compared to standard strategies.
Showcase of our strategy
The S&P 100 index includes 100 major, blue chip companies in the United States. It is representative of large-cap market performance, featuring companies with stable earnings and strong histories. Our Fractional Momentum Strategy leverages these characteristics by identifying momentum within these giants, optimizing for the dynamics of well-established firms.
The S&P 500 index includes 500 of the most prominent and widely traded companies in the United States. It serves as a broad measure of large-cap market performance, encompassing a diverse range of industries and sectors. Representing approximately 80% of the available market capitalization, the S&P 500 provides a comprehensive indicator of the overall health of the U.S. economy.
The NASDAQ 100 index includes top 100 non-financial companies listed on the NASDAQ stock exchange. It is heavily weighted towards technology, biotechnology, and growth companies.
The Russell 2000 index is a small-cap stock market index that includes approximately 2,000 of the smallest publicly traded companies in the U.S. It represents a diverse range of smaller businesses with growth potential.
Brazilian market index strategy configuration.
French market index strategy configuration.
German market index strategy configuration.
Hong Kong market index strategy configuration.
Japanese market index strategy configuration.
UK market index strategy configuration.
Explore this strategy
Please log in to explore and customize your Fractional Momentum PortfolioOpt.
Cite this work
This work relies on our paper Momentum Without Crashes. This paper can be cited as:
Chitsiripanich, Soros and Paolella, Marc S. and Polak, Pawel and Walker, Patrick S., Momentum Without Crashes (November 14, 2022). Swiss Finance Institute Research Paper No. 22-87, Available at SSRN: https://papers.ssrn.com/sol3/papers.cfm?abstract_id=4280465
BibTeX citation
            @article{momentum-without-crashes,
                author = {Soros Chitsiripanich and Marc S. Paolella and Pawel Polak and Patrick S. Walker},
                title = {Momentum Without Crashes},
                journal = {Swiss Finance Institute Research Paper No. 22-87},
                year = {2022},
                note = {https://papers.ssrn.com/sol3/papers.cfm?abstract_id=4280465}
            }